Density and Color Profiles
Evaluation of Color Gradients and Diffusion Processes
With microscope spectroscopy it is also possible to detect the distinct change from one color to another. Examples for such changes are temperature or humidity influences, diffusion processes, chemical or electrochemical factors, material properties etc. Another focus of interest is verification of layer thickness, uniformity of material, density profiles or color gradients.
Detection of Color Changes and Diffusion Effects
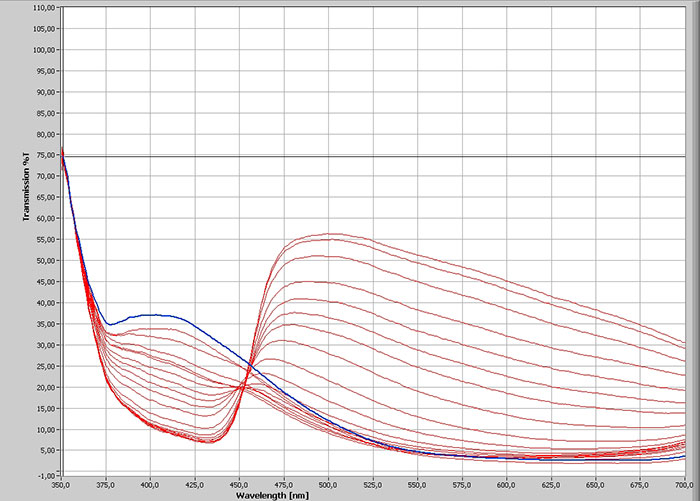
Spectra collected under the microscope are able to monitor for example the migration of moving fronts. The spectra below show the color change of a smart label caused by chemical or electrochemical doping changes that display a moving front corresponding to water diffusion. The migration length of the doping front is dependent on time and temperature. The label can be used as a time–temperature integrator that monitors and reports product storage conditions. The intervals between the measuring points were 5 μm. Recording was done with an objective 10x and a measuring pinhole with a diameter of 5.0 μm.


Color change of a label based on intrinsically conductive polymers with electrochromic behavior (change color when energized by electrical current). Acknowledgement: Prof. M. Knoll, University Münster, Germany
Examination of Coatings, Density Profiles, Gradients
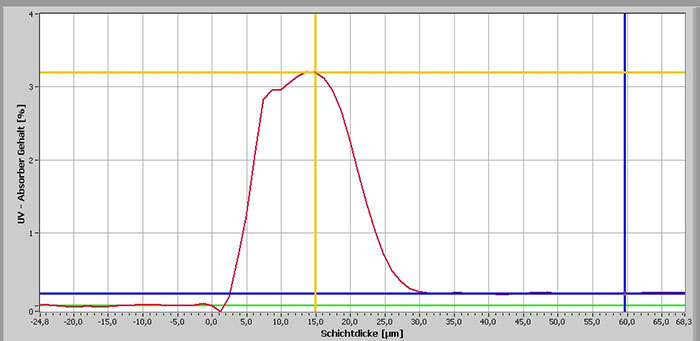
Evidence of layer thickness, uniformity, density profiles or gradients is another focus of interest. The cross-section of a polycarbonate layer displayed below shows the layer thickness of an UV-absorbing coating calculated by a spectroscopic Deep UV ratio profile. The optimized thickness of a layer determines the production costs, but it also prolongs the materials long term stability. In addition the optical characteristics of such transparent coatings can be evaluated. Investigations in profiles of layers and gradients are benefiting substantially from motorized instrument functions allowing automated processing and spectral mapping. Especially the drawing of polylines accompanied by an automated suggestion how many spectra along the line will be necessary to obtain a reliable result is a powerful tool to accelerate a workflow.


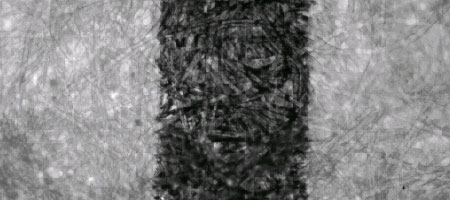
Cross-section through a polycarbonate layer covered with UV absorber. The graph examined by ratiospectroscopy displays the layer thickness.
Further Application Examples:
- Examinations of colored coatings/layer analysis in Deep UVNIR transparent materials
- Surface evaluation of wafer and semiconductor chips
- Dissolution and diffusion behavior of substances on contact with solvents
- Dye absorbance of materials
- Diffusion of glue on absorbing surfaces