Calibration Modules for Microscope Spectrometers
Quantitative Measurements and Quality Control
Spectroscopic measurements are comparative measurements in which the quotient between a reference material and the sample to be measured is formed. Besides preparative alterations there are always constant influences of the measuring instrument and other variable deviations through abrasion, such as changes in the optical performance of filters, beam splitter coatings, lens transmissions and lamp aging.
In order to ensure reproducible results in the long term, these parameters must either remain as constant as possible, or a comparison with reference materials is used to quantify their influences and to adjust the data.
Calibration of UV-VIS-NIR Spectrometers
For wavelength calibration and the check of photometric accuracy on UV-VIS-NIR microscope- spectrometer workstations A.S. & Co. has developed calibration tools with a QC-software module. Depending on the type of light microscope, the calibration or requalification can be done either manually or fully automatized. The user is guided through two independent measurements: proof of wavelength accuracy and check of photometric accuracy (evaluation of the dynamic range) of his spectrometer, which characterize the status of the workstation and the quality of his results.
The QC-module consists of an all-glass filter set in a special A.S. & Co. design, which enables the positioning in a parallel beam path. A Holmiumoxid glass filter is used to verify the wavelength accuracy. The neutral density (ND) filter set is used to check the photometric accuracy. The ND filters attenuate by their glass properties and do not have any extra coating. Therefore they are long term stable. Each standard is shipped with a certificate from the German Calibration Service (DKD), defining its characteristic values.
The filters can be mounted in a slider, a filter wheel or a motorized filter changer. Integrated into the SpectraVision hard- and software concept, the user can run the measurement either manual or in combination with a motorized setup fully automatized. Preferably we use the Zeiss microscope types Axio Imager or Axio Scope, but also the integration of older workstations like the MPM or UMSP works fine. From the portfolio of Leica microscopes we can adapt the series DM2000, 4000 and 6000 and the photometers MPV2 and MPV3. From Nikon we use the Eclipse series.
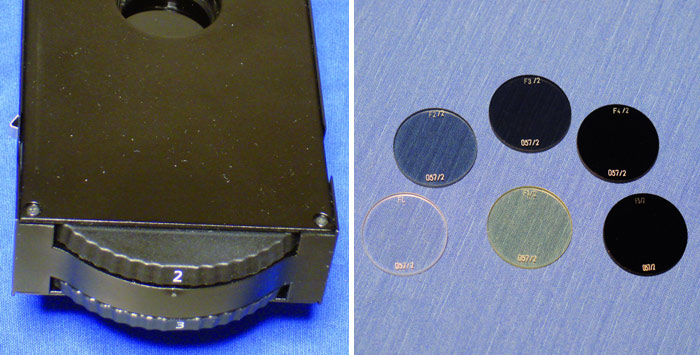
Manual filter changer and a QC filter set containing different ND gray filter and a Holmiumoxid wavelength reference
© A.S. & Co. GmbH
Check of Photometric Accuracy
When running a functional test for photometric accuracy on photomultiplier and CCD microscope spectrometers to check their dynamic range A.S. & Co. uses neutral density (ND) filters with constant thickness and optical densities from 0.0 to 3.0 OD (optional higher). This enables the measurement of calibration curves. The graph should be linear in the range between 0.5 OD and 2.5 OD and a decrease of the slope is expected for the low and high dynamic regions. Especially for the values larger than 2.5 OD this curve gives an impression about the ability how precise a measurement of dark black samples can be differentiated.
The results are displayed automatically in 5 wavelength charts according to the calibration certificate. The user will get the confidence that his instrument is working correctly within its given specifications. The procedure can be done in regularly intervals and will discover deviations in an early stage.
The benefit for the user is that he meets the requirements of his quality management and he ensures that the system measures his samples with the best possible performance. For example a forensic user can estimate if he can differentiate deep black fibers in a comparative measurement; the user in life science, in industry or in petrography can see, if samples with low brightness and contrast (e.g. a fluorescence or dark field signal) can still be differentiated enough, so that a quantitative analysis based on the greyscale values is possible.
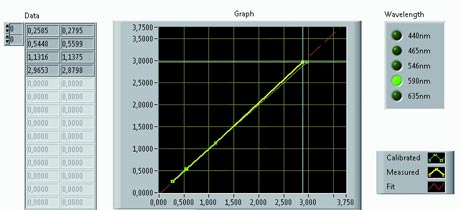
Calibration curve with variance analysis for the selected wavelength 590 nm
© A.S. & Co. GmbH
Proof of Wavelength Accuracy
Holmium Oxide Filter as Wavelength Reference Standard
To ensure wavelength accuracy A.S. & Co. uses a holmium oxide glass filter, which is integrated into the infinity space inside the microscope beam path (comparable to the discussed ND-filter). The spectrum of holmium oxide shows defined peaks over the full spectral range. The maxima derived from the calibration certificate are compared with the measurement results and their deviation can be used to define the quality range. The optical properties of the holmium peaks may shift slightly, due to the influence of the production batch on the glass matrix; therefore each holmium oxide filter is calibrated individually and gets its own calibration certificate from the German Calibration Service too.
With the SpectraVision QC-Module from A.S & Co. the user can perform functional tests on his workstation either manually in regular intervals or fully automated during the instruments‘ wake up. This way the user can proof and document the functional performance of his instrument according to the specification. The software guides him through the measurement and provides a reporting with protocol.
The QC-tests on the microscope-spectrometer workstations can also be performed as remote service and they are integrated in our A.S. & Co. Service contract concept.
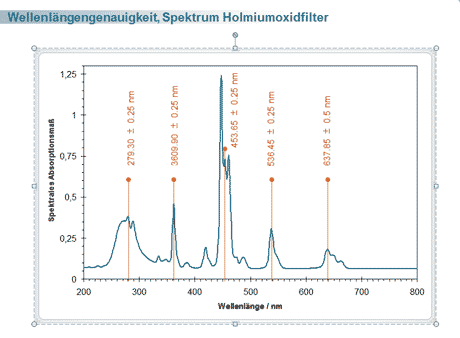
Typical spectrum of a holmium oxide glass filter.
Foto: Dr. Markus Stübner, LKA Munich/FRG
Automatic peak detection according to a predefined selection of quality criteria
© A.S. & Co. GmbH
Gas Discharge Lamps as a Tool for Determining the Wavelength
For estimating the accuracy of the wavelength spectra of gas discharge lamps can be measured, because they have some on the tenth of a nanometer precisely defined peaks distributed over the measurement range. Due to a barely changing gas composition they emit their well-known emission spectrum consistently in the medium term and can serve for referencing the spectral properties of the monochromator/array combination in a constant manner.
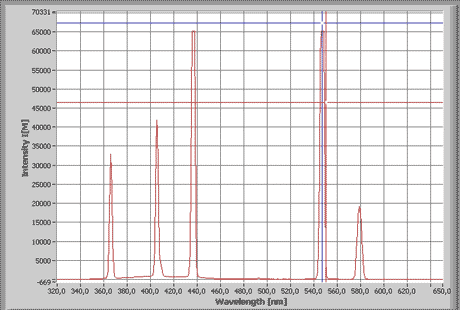
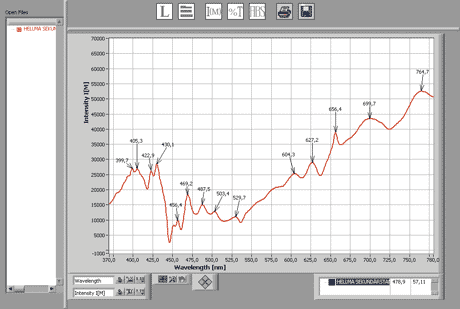
Spectrum of an HBO lamp. Their steep peaks are characteristic of this type of lamp and provide an optimal reference for a spectrometer calibration
© A.S. & Co. GmbH
A. S. & Co offers selected calibration lamps with wavelengths from 190 to 900 nm. As the most important short-wave lamp the HBO quartz heater has to be emphasized with the wavelengths 184.9 nm, 253.6 nm, 312.5 nm, 365.0 nm, 404.7 nm, and 435.8 nm.
For the long-wavelength range, we recommend a krypton lamp with defined peaks at 427.4 nm, 450.2 nm, 556.2 nm, 587.1 nm, 599.3 nm, 645.6 nm, 758.7 nm, 768.5 nm, 785.5 nm and 806.0 nm.
Both lamps will be delivered with stabilized power supply in specially prefabricated attachments, allowing a direct coupling into the microscope. In case that all ports of the microscope are already occupied, there is the possibility of beam coupling by means of a switchable path deflecting mirror.
Standards for Reflected Light Microscopy
For working in reflected light the same basic conditions apply. For this application either calibration standards with defined reflectance characteristics or silicon wafers are used as reference material. The following diagrams show typical calibration standards for the maceral analyses and their reflectance characteristics at 546 nm.
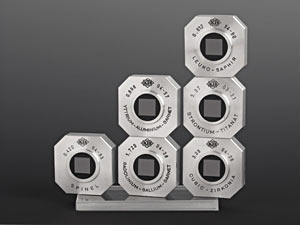
Calibration standards for reflected light microscopy to perform reflectance measurements of macerals
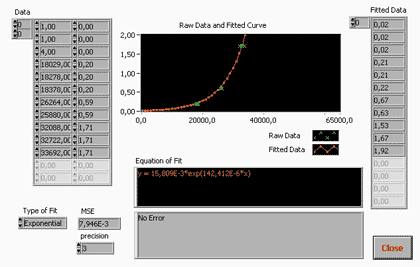
Calibration curve in the reflectance mode with display of measured values and the curve fit, as well as details about adjustment and the quality of the result
©A.S. & Co. GmbH
System integrated Fluorescence Calibration
Fluorescence Calibration versus a Halogen Lamp
The standard materials have in common that their properties change with irradiation. Therefore, they are of limited suitability as calibration standards. As alternative to those fluorescence standards we offer a calibration method based on Ottenjann1, which compares the fluorescence intensity versus an intensity spectrum of a halogen lamp. The halogen spectrum can be defined system- independently by the Planck constant and thus provides a stable and reliable long-term fluorescence standard.
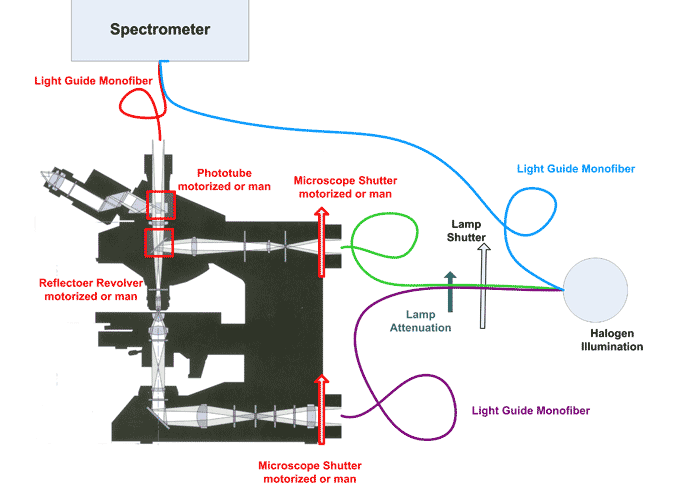
Fluorescence calibration versus a halogen lamp
©A.S. & Co. GmbH
Based on this reference the colorimetric characteristics of the microscope are evaluated and compared to the individual color sensitivity of the sensor. The deviation will be calculated and entered into the data. Combined with the knowledge of various instrument parameters we will get a fluorescence signal independent of the instruments parameters. All steps are controlled by our SpectraVision software, which guides the user through the process. Combined with a motorized microscope, the whole process runs even completely automatically with one click.
The complete calibration method is available as integral part in the workstations of A.S. & Co., thus providing a major advantage for the user:
- no complicated handling
- no grapple with awkward tools
- even inter-laboratory comparisons are possible, as no user dependent differences occur