UV Microscope Spectrometer for Fiber Analysis
Forensic investigations on fibers and transmitted light samples
A fiber microscope is designed for deep UV range, because in addition to color analysis it provides the option to differentiate synthetic and natural fibers. Standard light microscopes are not DUV compatible and can take irradiation damage under DUV. Therefore, A. S. & Co. upgraded the beam path suitable for DUV. Thus, with the lowest possible radiation the best performance and long-term stability is achieved.
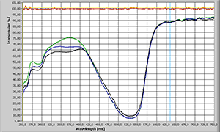
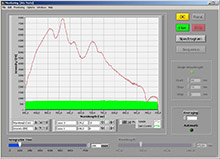
Deep UV transmissions spectrum at three different positions of a fiber to determine color and homogeneity. The parallel recorded 100% line provides information on the stability of illumination intensity and sensor noise.
© A.S. & Co. GmbH
Technical Features
- extremely stabilized light sources with intensity fluctuations of less than 0.3% ensure precise measurement results
- short light paths without the use of components containing optical coatings and adhesives, which lead to an ongoing change in device properties due to their aging or by irradiation with high-energy UV light
- stray light reduction by focusing the illumination- and measuring area on narrow elongated shapes in order to avoid a decrease of the dynamic range by over-exposure
- apertures with integrated illumination to project the aperture image online into the eyepiece when the system is equipped with a reflector revolver and a tube with beam splitter. This provides for more precise alignment of the measuring sample and higher data quality.
- avoiding the losses of light intensity due to chromatic aberration by the use of aplanatic, achromatic optics with long working distance for condenser and lenses
- cooled CCD sensors with good signal to noise ratio
- fully automatic calibration
- motorized microscope functions
DUV Koehler Condenser with High Precision Fine Drive
Our deep UV Koehler illumination improves the performance significantly. This can be proven impressively on the example of a black fiber measured in DUV transmission.
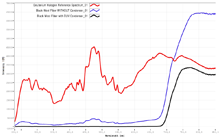
Comparison of black fiber spectra. Black curve: with DUV Koehler condenser, blue curve: without DUV Koehler condenser, red curve: reference spectrum of the deuterium halogen lamp. The black curve runs on the baseline, i.e. due to the DUV Koehler arrangement all scattered light is prevented within the measuring range. In contrast, the data received without condenser are biased by stray light. The blue curve shows scattered light fluctuations, which correspond to the deuterium halogen lamp and may cause a measurement error of up to 10%.
© A.S. &
Co. GmbH
With a stray light rejection to almost 0 in the microscope spectrometers of AS & Co. of course they are suitable perfect for measurements on the limits of the optical resolution in light microscopy. This approach is based on our in-house-developed Koehler condenser with high precision fine drive, which was designed to align an extremely small field stop under high magnification.
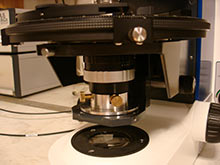
DUV Koehler condenser with high precision fine drive
© A.S. &
Co. GmbH
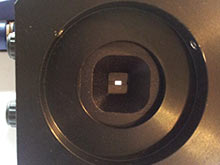
External field stop; when using a total magnification of 1600x an area of < 2x2 μm can be illuminated.
© A.S. &
Co. GmbH
Working with such a small aperture offers advantages:
- Undesired high energy, which destroys lenses and coatings inside the microscope, is reduced to a minimum.
- The excitation light is focused precisely to the sample area only.
- Full exposition with the best possible numerical aperture.
- The exposition time of the sample remains in the millisecond range.
- Thus, the sample will not get damaged by heat or high energetic light.
- These properties avoid costs for extra maintenance and replacement of optical parts and lenses
Fast Operation by Online Monitoring in a single Window
A fast and reliable check of the illumination and measurement condition is important to get the maximum dynamic range and the highest precision for the measurement. The Autoadjust function in software is a valuable tool for the independent definition of the optimal measurement duration and the evaluation of the best dark current signal. The objective to measure a spectrum is achieved with a few simple steps.
The SpectraVision monitoring window displays all necessary information to prepare the experiment and shows the dark current clearly with one click.
© A.S. & Co. GmbH
Motorized Microscope Functions simplify the Measurement
SpectraVision microscope spectrometers are available with various comfort levels. In combination with simple routine microscopes only the measurement and the dark current detection is automated; when using motorized research microscopes, the SpectraVision software is able to control the illumination and the use of light-reduction filters and to switch a prism in phototubes or camera ports.
The use of light-reduction filters allows the adaption of the illumination for measurement, without the need to change the intensity of the illumination system itself. This ensures the most stable and clearly defined intensity at all times. Motorized phototubes allow the automated switching betweena splitted observation beam path to the eyepiece and the 100% deflection of the light to the sensor, for the observation of samples that show weak intensity.
Furthermore a complete system autoinspection can be arranged by one click. It will take less than a minute, and the certified results are collected in reports, which are useful tool to demonstrate the systems stability every day.
The clear design of the software allows a fast generation of a library of data comprising reference, sample and comparative spectra, including automatic assignment of comments and record identification data. Once the header is defined, the user just needs to focus to the region of interest. Recording of the spectrum is done with one mouse click.
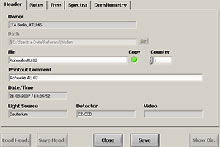
The SpectraVision software automatically stores as Header automatically all information for the identification of device and data, sorts the spectra in ascending order and provides space for individual notes.
© A.S. & Co. GmbH
A first evaluation can be done by a visual comparison of spectra. The evaluation window allows the comparison of the data. Useful tools like averaging and the graphic presentation of their variations assist in the interpretation of the results. Further tools such as addition, subtraction, normalization and derivations are available. If mathematical calculations are required, this can be done with scatter analysis. The degree of spectral consonance can be calculated with Euclidean distance function. For further individual evaluations the data can be exported to Microsoft Excel or other analysis programs.