Spectroscopy with the Stereomicroscope
Color measurement of writings, paintings and surface structures
The SpectraVision Stereomicroscope Workstation combines the benefit of the new stereomicroscopes with simplified sample preparation and provides new ways for the quick colorimetric differentiation of traces of evidence, surface structures and material analysis of art treasures.
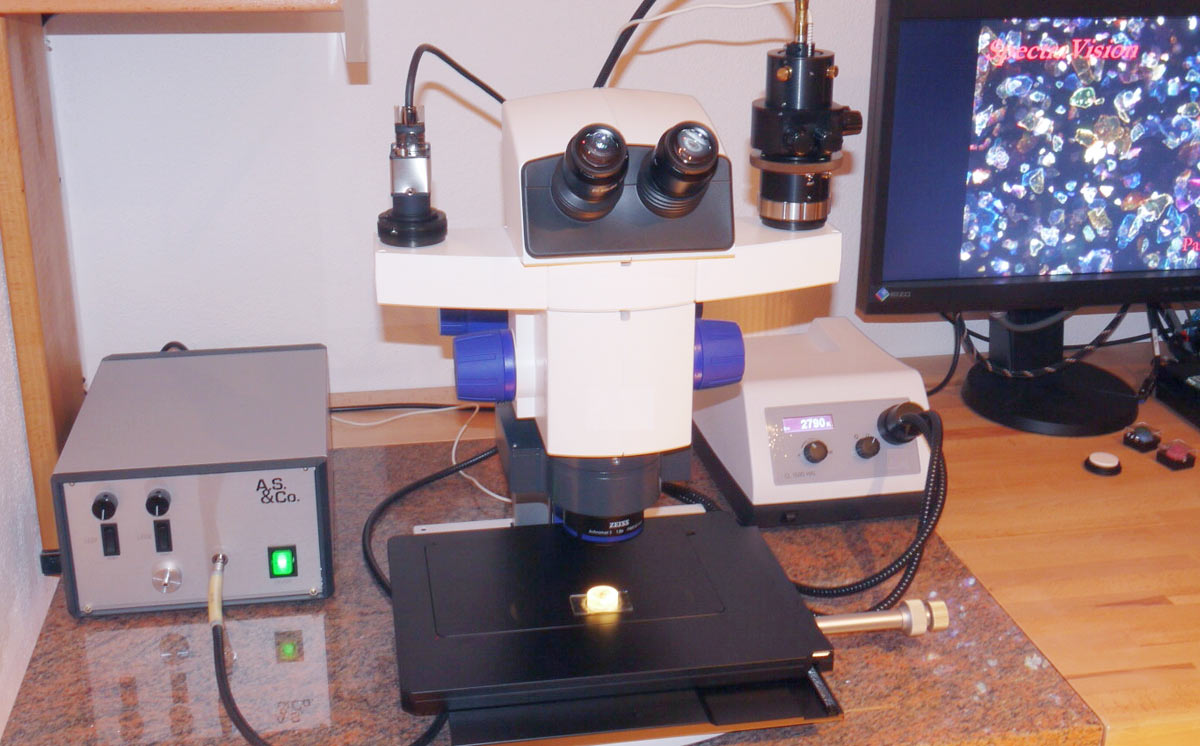
A modern stereomicroscope with dual TV cmount adapter simultaneously provides spectra and photographs from the identical sample position
© A.S. & Co. GmbH
Technical Features
- aperture with integrated illumination and display of the aperture image in the eyepiece when the system is equipped with a reflector revolver and a tube with beam splitter. This provides for a more precise alignment of the measuring sample and higher data quality.
- avoiding the loss of light intensity due to chromatic aberration with the use of aplanatic, achromatic optics with long working distance for the condenser and lens.
- cooled CCD sensors with high sensitivity for the display of spectra from light-critical dark field measurements.
- cost-efficient photodiodes and non-cooled CCD arrays cover the complete VIS range and are using the standard illumination of the microscope.
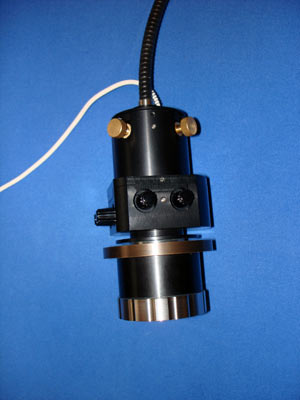
Fiber collimation system with high precision xyz- alignment
- xy-fiber alignment of the collimator
- Adjustment of pinhole size and position
- z-focusing
© A.S. & Co. GmbH
Combination of various Crime Scene Analyses
The SpectraVision Stereomicroscope Spectrometer is designed for measurements in reflected light mode . In the basic configuration the system is designed for spectral range from 350 nm to 750 nm and fulfils the requirements of colorimetric measurements following CIE-Lab guidelines.
Stereomicroscopes can be equipped with several TV ports. Thus, in addition to spectroscopic data also overview screens showing the place of the sample’s origin can be recorded using image analysis techniques and 3D reconstruction. The combination of expressive photos with microscope spectra for track differentiation, created in a single operation step, can speed up the case evaluation and offers room for an increased number of evaluations as a basis for solid statistics.
Motorized Microscope Functions simplify the Measurement
SpectraVision Stereomicroscope Spectrometers are available with various comfort levels. Using a manual stereomicroscope, all spectroscopic steps need to be done manually. Using an electronically operated light source, the evaluation of the dark current and the measurement processes can be automated.
The combination with a motorized z-drive allows the creation of images with extended depth of focus, to which in a further step, spectral measurements can be performed. If the workstation will be supplemented by a scanning stage, this functionality can be extended to a spectral mapping.
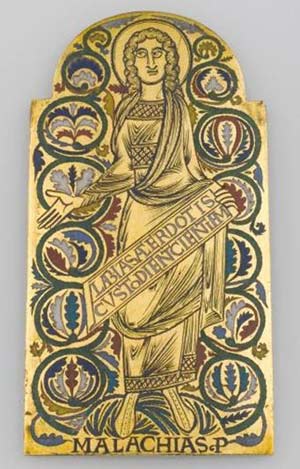
Plaque of the Darmstadt Tower Reliquary. Restoration studies have shown that there has been a revision of the object.
Picture: Dr. Stefan Röhrs, Rathgen Forschungslabor, Staatliche Museen Berlin
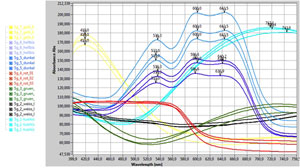
Microscopically spectrometric investigation of the enamel as a base of the analytical analysis on its allocation to production period and production place.
Color spectra: Dr. Stefan Röhrs, Rathgen Forschungslabor, Staatliche Museen zu Berlin
High Sensitivity also with Fluorescence Measurement
In its basic configuration the SpectraVision Stereomicroscope Spectrometer includes a Peltier cooled CCD array with 1024x80 pixels as a spectral sensor. Combined with monofibers and appropriate adaptors from A.S. & Co. a high sensitivity workstation becomes available, suitable to analyze samples with fluorescence. Thus, a first microscopical examination of the traces on a potential DNA content would be an option. In addition, a quick diagnosis based on autofluorescence may help to classify particles into biotic and abiotic types. In consequence the spectral differences of flavins may serve as a marker for plant origin.
Fast Operation via Online Monitoring Function from a single Window
A fast and reliable check of the illumination and measurement condition is important to get the maximum dynamic range and the highest precision for the measurement. The Autoadjust function in software is a valuable tool for the independent definition of the optimal measurement duration and the evaluation of the best dark current signal. The objective to measure a spectrum is achieved with a few simple steps.
The clear design of the software allows a fast generation of a library of data comprising reference, sample and comparative spectra, including automatic assignment of comments and record identification data. Once the header is defined, the user just needs to focus to the region of interest. Recording of the spectrum is done with one mouse click.
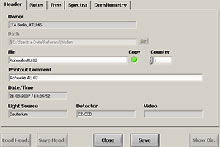
The SpectraVision software automatically stores as Header automatically all information for the identification of device and data, sorts the spectra in ascending order and provides space for individual notes.
© A.S. & Co. GmbH
A first evaluation can be done by a visual comparison of spectra. The evaluation window allows the comparison of the data. Useful tools like averaging of the data and the graphic presentation of their variations assist in the interpretation of the results. Further tools such as addition, subtraction, normalization and derivations are available. If mathematical calculations are required, this can be done with scatter analysis. The degree of spectral consonance can be calculated with Euclidean distance function. For further individual evaluations the data can be exported to Microsoft Excel or other analysis programs.
For documentation standard protocol templates as well as variable templates are available, in which the data of the measuring process and their result are entered automatically.