Quantitative Microscopy in Geology
Petrology and Economic Geology
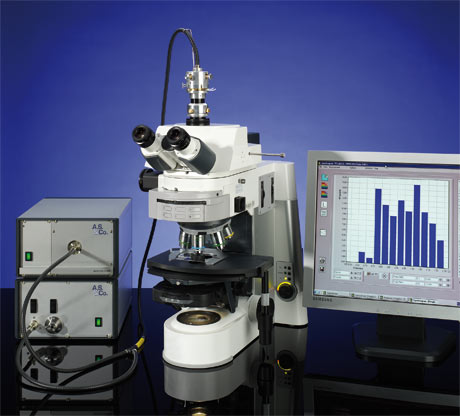
The SpectraVision concept allows combining modern manual and motorized microscopes together with highly stabilized light sources and photomultipliers or CCD sensors with brightfield-, polarization- and fluorescence spectrometers. The workstations of A. S. & Co. are optimized for best performance and reproducibility, especially for low-light samples in petrography. A. S. & Co. systems are used by Petrographers for measuring the vitrinite reflectance, maceral analysis, measurement of dispersed organic matter (DOM) and for quantitative fluorescence measurement.
Investigations according to DIN/ISO/ASTM Standards
In addition to maceral composition and mineral content the options of using coal or species mixture depends crucially on the degree of carbonization of the substrate. Therefore microscopic vitrinite reflectance measurements determine the sales value and the usability of fossil fuels. In addition to chemical and physical analyses they provide the prerequisite to characterize the raw material according to DIN / ISO and ASTM.
With SpectraVision von A.S. & Co. of A. S. & Co. the vitrinite reflectance is measured according to the DIN / ISO standards 7404-5:1994 and 22020-5:2005-02 as well as to the ASTM D2798, thus providing histogram analyses of the composition of the coal and its carbonization. The variability in the data is minimized due the very low stray light and the absence of moving parts in the microscope. As a result the system gains the highest sensitivity and reproducibility in its class, it allows a reliable determination of coal quality or enables to use data in simulation calculations.
SpectraVision determines for the sensors used
- the consideration of individual sensor characteristics by the use of up to 15 standards
- the reflection characteristics of the calibration standards at 546 nm
- the histogram evaluation according to ASTM / DIN / ISO standards
- statistical parameters such as mean and standard deviation
- the distribution of the multi-component analysis
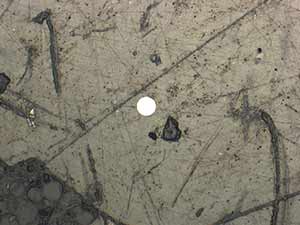
Vitrinite reflectance in brightfield:
Spot measurements with defined circular pinholes enable an optimal recording
of objects according to the international standards.
© A.S. & Co. GmbH
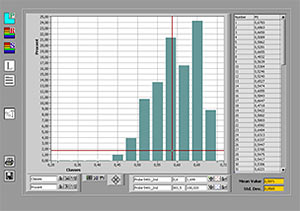
SpectraVision histogram of vitrinite reflectance showing the individual values, arithmetic mean and standard deviation according to DIN/ISO und ASTM standards
© A.S. & Co. GmbH
Spore Color Measurements and Determination of the Maturity of Sediments (Maturation Studies)
For this application, Ottenjann demonstrated already in 1980 and 1988 that microscope spectroscopy is an important method for determining the formation and maturity of macerals (Ottenjann, K., 1980. Leitz Mitteilungen für Wiss.- u. Technik 7, 262-273; Ottenjann, K., 1988. Org. Geochem. 12/4: 309-321). Ottenjan used a standard light microscope, upgraded with a prismmonochromator and a photomultiplier unit. Today, CCD Arrays are used, which cover the visible wavelength range of a maceral within a split second.
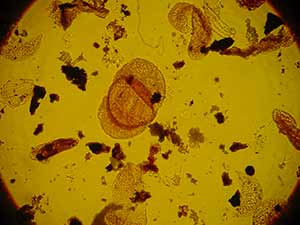
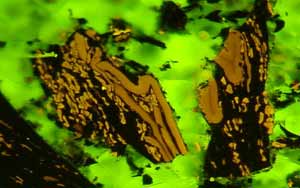
Microflora in sediments observed via transmitted light
© A.S. & Co. GmbH
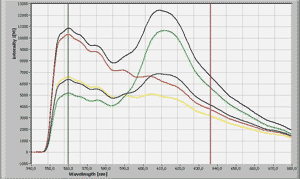
Absorption characteristics of different meiospores in transmitted light. The red and grey curves show the wavelength of the red/green ratio.
© A.S. & Co. GmbH
Imaging Systems combined with motorized Microscope Stages
The basic assembly synchronizes camera and stage thus allowing defining measurement positions via an onscreen overlay of data. For this the region of interest can be selected at the video image by click and be analyzed over a predefined measurement area. The result is a rapid measurement and documentation depending on the dynamic of the camera used.
Alternatively, the coordinates of selected measurement points are registered during the vitrinite measurement in a database. In a second step, the vectors are automatically retrieved point by point and the sample will be positioned accordingly in the optical axis. Now the reflectivity for each measurement point can be recorded by a photomultiplier (PMT) with a much higher dynamic range to be validated according to the international standards. In the same way a spectrometer can additionally record the color information of the measuring points.
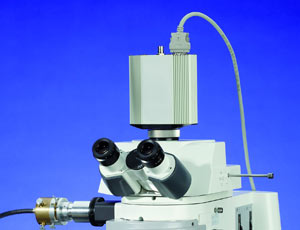
Cooled CCD camera for recording vitrinite reflectance and weak fluorescence signals in addition or alternatively t
o a photomultiplier measuring head.
© A.S. & Co. GmbH
Using image analysis, large areas can be quickly assembled and analyzed fully automatically based on calibrated recording conditions. Thus, the number of measurement values needed for statistical evidence can be generated in time efficient way. Again, the image analysis gains even additionalevidence if it can be validated at regular intervals against an established photomultiplier measurement procedure on identical microscope conditions.
Combined Vitrinite Reflectance and Fluorescence Spectroscopy
As an alternative to a PMT or an imaging system a cooled CCD spectrometer can be used to detect the maturity of macerals based on vitrinite reflectance quickly and reliably. Since cooled sensors record continuously at a constant operating temperature, the thermal variances are minimized. In addition to the DIN standard that requires to record vitrinite measurements with an error of less than 1%, this is also advantageous for fluorescence measurements and provides faster results with improved signal-to-noise ratio.
Advantages of spectral measurements:
- fluorescence spectrum and integral of the wavelength of 546 ± 6 nm for the vitrinite reflectance in one step, i.e. spectrum, red/green ratio and VR value are available
- correlation of the decrease of vitrinite reflectance and the increase in fluorescence intensity
Since it can be measured in brightfield and fluorescence spectroscopy without inserting interference filters, the measuring point remains strictly focused to one spot even at highest magnifications. Therefore cooled CCD array spectrometers are particularly suitable for workstations where in addition to the vitrinite reflectance also fluorescence spectroscopy should be operated.
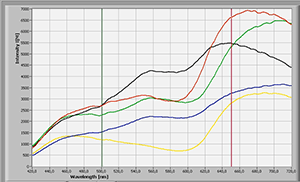
Liptinite fluorescence in a coal cross-section, excited by blue light at 488 nm
© A.S. & Co. GmbH
Fluorescence spectra of macerals with different maturity. By means of the red/green quotient, the maturity may be determined.
© A.S. & Co. GmbH
Polarization Microscopy
Classic polarization microscopy remains an indispensable part of quantitative geology, since the evaluation of the degree of anisotropy of coking coal through the amount of reflectance in polarized light is a fast method to distinguish the components of the sample.
In combination with spectrometer modules SpectraVision from A.S. & Co. extents the options of polarization microscopy through
- the rapid registration of maximum and minimum values of the reflection as a function of the rotation angle
- the recording of spectral changes in the online monitoring modus and its interpretation by Michel Levy
- recording the spectra and their analysis against reference curves based on data from the literature or measured calibration
As an option, the standardized color metrics according to CIELab may be added to achieve reproducible, standardized routine measurements.
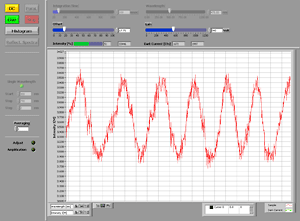
Intensity oscillation of a maceral reflectance under polarized light. Requirement to display the minimum and maximum histograms, with which the quality of the maceral can be classified
© A.S. & Co. GmbH
A. S. & Co. Developments to improve System Sensitivity
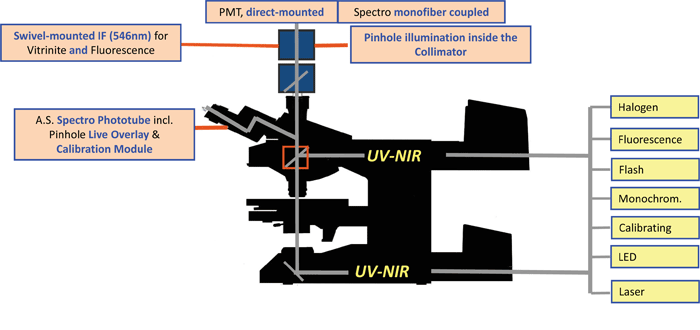
Specific, by A. S. & Co. developed modules to increase sensitivity lead to a significant improvement in the informative value compared to standard microscopes that are used as the basis of the conventional systems available on the market so far:
- the direct mounted photomultiplier tube (PMT) shortens the light paths. In contrast, a fiber coupling loses about 30% performance at this position.
- mono fiber-coupled spectrometers provide a significantly higher signal transmission from the microscope to the sensor compared to the conventional y-fiber.
- an integrated light source inside the fiber collimator allows the direct illumination of the measuring aperture and prevents the loss of light by beam splits in the microscope.
- modified spectro phototube: The standard phototube was optimized to a higher light throughput. Since all optimizations potentiate, the improved light throughput at the tube has a positive impact on the overall performance and reproducibility. Together with the A. S. & Co. product "Live overlay module" the illumination pinholes and measuring pinholes are reflected direct to the eyepiece. The viewer observes the sample image as well as the aperture, its position, size and sharpness simultaneously live.
A swivel-mounted IF (546nm) in the PMT optical path above the photo tube makes handling for vitrinite and fluorescence measurement extremely convenient and minimizes the variability in the data.
Comparison of the Sensors
| Photomultiplier with Signal Amplification | Spectral Sensors | Imaging Systems | |
|---|---|---|---|
| Dynamic Range | 128.000 Grey Scale | 16.000 Grey Scale | 4.096 Grey Scale |
| Amount of Gray Values to distinguish the VR Range 0.4 - 1.0% |
18.000 | 2.400 | 600 |
| Electronic Noise | ± 0,2% | ± 0,4% | ± 0,4% |
| Complies to DIN / ISO / ASTM | Yes | In Preparation | In Preparation |
| Spectral Results | Option | Standard | No |
| Acuracy | Color | Speed |