Spectroscopy for Aurofluosescence Measurements
Microscopic Analysis of Life Cells and Fixed Tissue
With the breakthrough of molecule-specific fluorescent markers one of the most serious upheavals in the microscopic analysis could be done. Since then it is possible to describe in detail transport and synthesis processes by using specific markers. The detection of spectral distributions within this segment is done by means of highly sensitive cooled CCD spectrometers.
A particular advantage of cooled CCD spectrometer is the measurement of autofluorescence. The detection of autofluorescence provides the attraction to receive the primary signal without immuno-histochemical staining and thus to be used for rapid tests. The method is also gentle to samples and can be used for measurements in life cells as well as in fixed materials. Of course, the reproducibility and significance are also high on the list of issues to be discussed with this method. In this respect, the application is focused on a specific group of substances. Foremost among these are:
| Adenine (exc.: 265 nm: em.:380 nm) | DNA-Oligonukleotides (exc.: 330 nm: em.:380 nm) |
| ATP (exc.: 272 nm: em.:390 nm) | Tryptophane (exc.: 340 nm: em.:348 nm) |
| Phenylalanine (exc.: 282 nm: em.:284 nm) | NADH (exc.: 340 nm: em.:470 nm) |
| Tryptamine (exc.: 285 nm: em.:360 nm) | Riboflavine (exc.: 370 nm: em.:520 nm) |
| Tyrosine (exc.: 306 nm: em.:309 nm) |
The excitation spectra lie between 265 nm and 370 nm and can be worked out best when broadband UV suitable light sources such as a halogen lamp or a deuterium XBO burner are available. The combination with a DUV-suitable monochromator optimizes the excitation precisely to the best response of a substance.
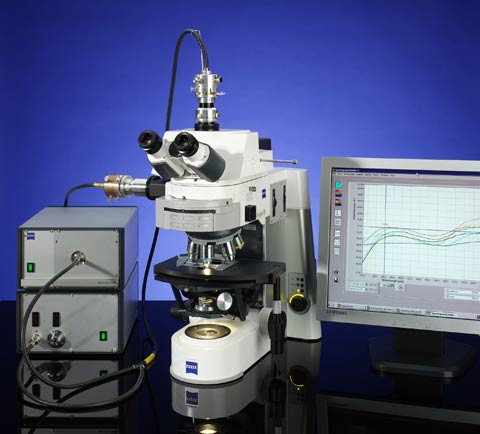
Microscope spectrometer system with lateral input
of a fiber-coupled XBO monochromator for Deep UV
excitation and a 100% phototube with fiber coupling
and adjustable pinhole system.
© A.S. & Co. GmbH
On the emission side the interpretation of fluorescence partly requires the nanometer-accurate separation between the intensity peaks, which at present can be realized exclusively by a cooled spectrometer with the best possible resolution.
SpectraVision microscope spectrometers from A. S. & Co. can be individually configured to meet these requirements and allow the detection of classical wideband signals to the point of extremely precise fluorescence peaks. In case of need it is possible to record time courses and to plot them as spectra plot against the time.