Software for Microscope Spectroscopy
The SpectraVision concept is based on a universal software for microscope spectroscopy. It includes the following functions:
- recording of the measured data from sensors (spectrometer, photomultiplier, 2D or 3D CCD cameras) and their analysis
- connecting of various types of illumination modules with the functions of the microscope control
- routines for automatic calibration
- determination of the sensor dynamics and scattered light properties on the microscope
- linking live video image presentation with motorized microscope stages for online preselection of measuring positions on the screen
Important Features for Measurement and Analysis
The basic software modules originate exclusively from our own development and were continuously upgraded in the last 10 years due to growing demands of customers. SpectraVision software modules can easily be linked with each other and are synchronized via an easy-to-use configuration menu.
The setting window - Instrument Adjustment with 3 Clicks
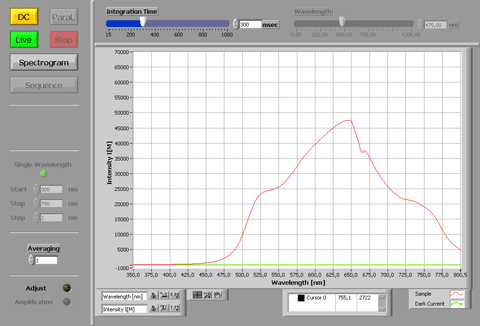
Monitoring setting window with live view of a halogen lamp spectrum (red) and the associated dark current (green)
© A.S. & Co. GmbH
The setting window allows fast access to a measurement in 3 clicks:
- dark current detection
- live image of the generated spectrum
- Auto-Adjust for automatically finding the best possible dynamic range
After detection of dark current and spectrum over the auto-scaling and auto-adjust function the optimal working conditions can be set quickly. Furthermore, also the information for working with excitation monochromators is to find. The fine-tuning of hardware and measurement parameters can be adjusted in the pull-down menu and can be saved as a method as well as the basics for the measurement and its accompanying comments in the header do. In addition, numerous alterations to graphics, cursors and wavelength range enable for optimum detail view in order to evaluate critical curves.
The Measurement Window - fast Operation by automated Routines
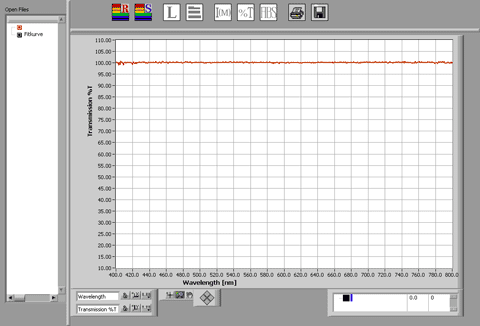
Starting a transmission measurement with the
determination of the spectral quality via recording of a
100% curve. The deviation is less than 0.3% over the
entire operating range, which is significantly below the
usual tolerance limit of 1.0%
© A.S. & Co. GmbH
In the measuring window, the focus is of course on the rapid recording of the results. In addition to recording of reference and sample the user is able to change directly between the various measuring modes. There is also the option to modify legends directly and to enter accompanying commentary in the header. For quick saving of data automated routines can be predefined up to direct transmission to external analysis programs.
A special feature of SpectraVision software is the linking of a live image video presentation with a motorized microscope stage. Advantage of this arrangement is the online preselection of measuring positions on the screen. They are buffered and can be analyzed by the spectrometer or the photomultiplier afterwards. The selection of the measuring position at the monitor is less tiring for the user. The subsequent independent measurement provides significantly more detailed information about optical densities and spectral distributions as compared to the traditional video densitometry with its limited dynamic range. All presetting necessary for that purpose can be fixed in separate pull-down menus within the SpectraVision software and are available in the measuring window for a rapid working process.
The Analysis - clearly arranged Comparisons
In addition to various options of direct appraisal of measurement results, such as the comparison of reference and sample it is advantageous if additional tools are available. Distinction has to be made between functions that optimize the presentation and mathematical calculations on statistics and quality assessment.
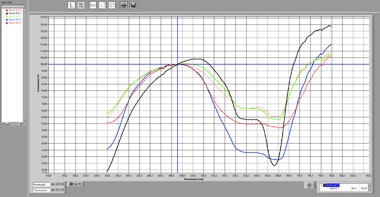
Example of 100 % normalization for comparison of spectra of different blue colored fibers
© A.S. & Co. GmbH
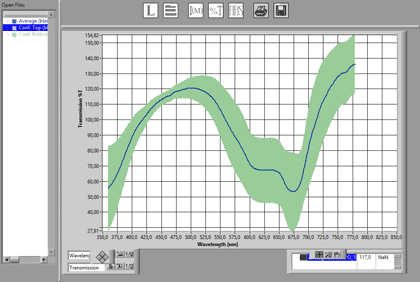
Average curve with confidence intervals of spectra of different blue colored fibers
© A.S. & Co. GmbH
The SpectraVision software provides a number of functions for optimization such as averaging of measurements, curve smoothing, curve additions and derivations. Furthermore it is possible to take the mean from curves, so that the standard deviation for the individual wavelengths can be determined and the Euclidean distances can be calculated.
In addition to these initial evaluation tools, the SpectraVision software provides a number of further tools. These include intensity histograms for detecting quantitative fluorescence distributions or for the requirements of the vitrinite reflectance measurements in the coal and steel sector as well as the reservoir geology.
Moreover, it seems likely to integrate the internationally-defined colorimetric CIELAB standards in order to perform microstructure analysis.
For coating technology, the SpectraVision software provides methods for reflectance measurements according to Sellmeier with appropriate possibilities to transfer them to the manufacturing process. For this purpose, limit values for reflectance, rising edges or half-widths of optical coatings can be predefined. In a second step, these can serve as performance criteria in quality control via direct online evaluation.
These internal evaluations are complemented by a set of interfaces that enable to include external programs. For example databases may be interesting, which provide the possibility of spectral comparison. As another example, the layer thickness measurement is to be mentioned, in which a recorded interference pattern of the used wavelength range is assigned using a mathematical approximation. Thus, under clearly defined conditions the thickness of optically transparent layers can be determined down to the submicron range.
Of course, the SpectraVision software also offers the classic ASCII transfer to MS Excel or to diverse scientific evaluation programs. The measurement of diffraction and the transfer of these spectral data in the theorems of Gustav Mie, for example, gives evidence about size and distribution of particles > 20 nm in colloidal solutions. The advantage of a light-microscopic preparation combined with the mathematical analysis can reduce the considerably more complex and more expensive electron microscopic preparation.
Automation and Control Functions
From the infinite number of software applications, we have focused on those facets, with which foremost a standardized measurement procedure can be reproducibly performed and documented. A fact, which sets us apart from our competitors is, that the SpectraVision software not only is able to register the measured data, but also structures the integration of the microscope. Completely manually operated instruments, but also fully motorized versions can be used. Whereas some users focus on economic aspects and like to perform only a few measurements, other target groups need the workstations in the 24-hour operation and expect the fastest possible delivery of results. The increase of PC-controlled processes correlates of course with the decrease of potential errors.
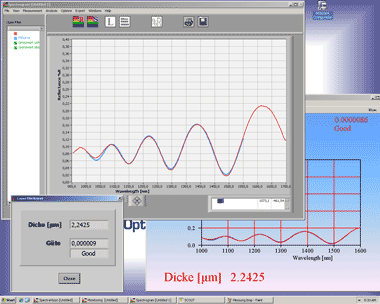
Fully automatic measurement of layer thickness with display of
the original reflectance spectrum, the curve fit to calculate the
thickness, a rough classification for rating the quality, and the
numerical result. This is preceded by input of a number of process
variables and quality criteria. They are fixed in a method file and
serve the production staff as a basis for in-process evaluation, i.e.
it is only necessary to specify the sample detail of interest during
the running process.
© A.S. & Co. GmbH
Additionally, the SpectraVision software provides a number of other benefits that are specifically designed for the user in daily laboratory routine or the practitioner in the production process. Due to the benefit of our in-house development, we are uniquely capable to program individual measuring sequences very quickly and to provide working at the push of a button.
This includes routines such as the automatic screening of calibration standards or the detection of sensor dynamics through swiveling-in of certified neutral density filters.
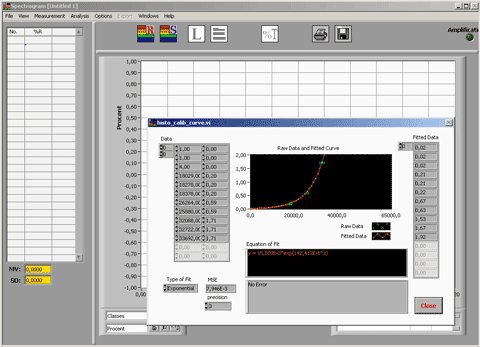
Creation of a calibration curve, which can be taken either for certification purposes or as a reference spectrum
© A.S. & Co. GmbH